Let’s look two trades that unfolded since that post.
I suggested that with the recent support made at 80.24 and it being so close to the historic support, 79.75, this would be a good time to plan trades.
According to classic Technical Analysis, you buy off support levels; if the support gets broken and tests it as a resistance, then you sell from the previous support.
So in line with the logic that we’re trading above key support levels, I looked for buy trades.
The very time of the post was a good entry for a long trade. There were some chart patterns that indicated a bullish momentum.
1. Key trendline was broken and retested before moving up
2. Recent “Double Bottom”
3. Forming of a “Base” bottoming pattern
4. Recent 78.6% Fibonacci bounce
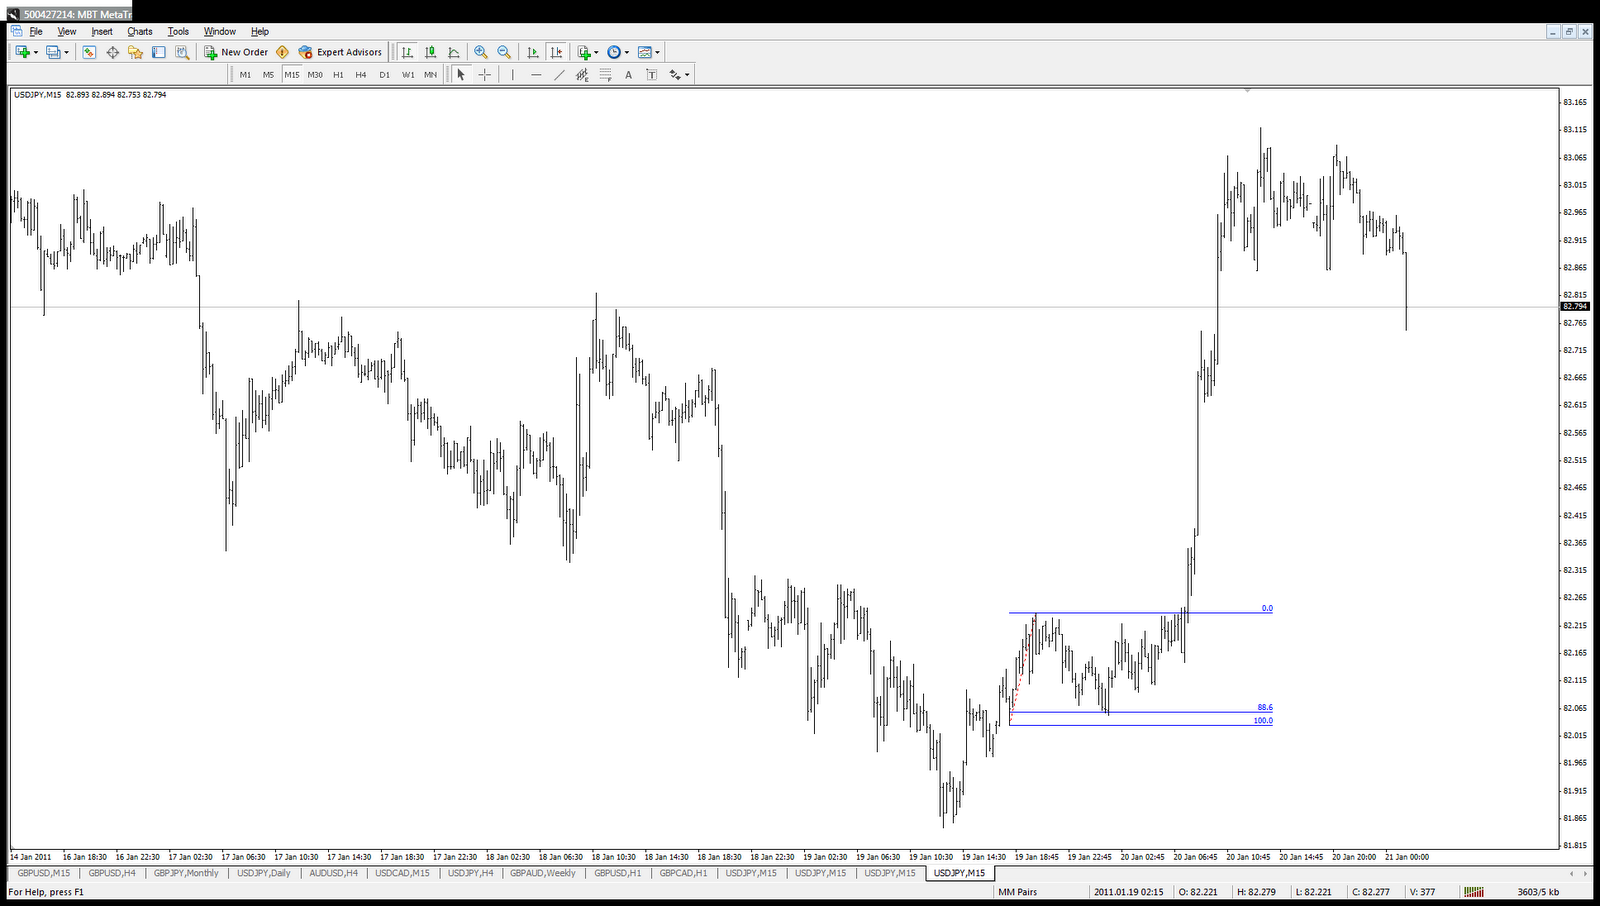
5. Recent 88.6% Fibonacci bounce

Trendline break & retest

Double Bottom pattern

Base pattern

78.6% Fibonacci bounce

88.6% Fibonacci Bounce
At the time of the post, the price was consolidating nicely. The price was making higher lows, and it almost immediately made a new 61.8% Fibonacci bounce:

61.8% Fibonacci bounce just prior to trade entry
So technically, the picture was looking bullish.
As the consolidation was tight, a 25 pip stop would have covered you easily. If you planned your trade around a simple 1:2 risk/reward ratio, you would have earned your 50 pips within hours. The price did actually rocket over 100 pips; that said, I rarely exit a trade after three times my risk, i.e. 75 pips in this case.
More recently, there was a brilliant text book example of a Reverse Head & Shoulders pattern. See the below chart:

The blue lines on the next chart mark an 88.6% Fib Bounce for the Right Shoulder:
88.6% Fibonacci bounce forming Right Shoulder of Reverse Head & Shoulders
My entry was at the consolidation for the Right Shoulder, 25 pip stop. I exited at 50 pips but the trade could have netted over 80 pips. I was content with a 1:2 risk/reward ratio on this trade.
H. Hamid
