
Monday 28 March 2011
40 pips today on EURUSD - 88.6 Level
The target was at the beginning of the retracement (Point 1), approximately 40 pips, and was hit within the hour.

Sunday 6 March 2011
Technicals for 1,000 pip plus moves
I had a conversation this week with a colleague (thank you Shyam!) about Technical Analysis versus fundamentals. We debated whether Technical Analysis is more appropriate for short-term trading whereas fundamentals trump the longer term view.
My view is this: I believe Technical Analysis is equally as effective in long-term analysis as it is in the short-term.
That said, Technical Analysis is a tool. It can be successful, but has to be applied with skill and discipline (just like fundamental analysis).
To illustrate how very accurate technical analysis is in the long-term, let’s do a step-by-step analysis of a long-term chart. We’ll look at the US Dollar versus the Swiss Franc, USD/CHF, on a current weekly chart.

Next step: I’ve labelled the last three major points on the chart.

Point 1: 1.19670; 12 March 2009
Point 2: 0.99090; 26 November 2009
Point 3: 1.17302; 1 June 2010
Now let’s look to see if there are any basic relationships between the three points on the chart. From Point 1, the price moved down to Point 2, retraced to Point 3 and then continued its moved down (in line with the longer term downtrend). Did the retracement from Point 2 to Point 3 match any key Fibonacci levels?

The above chart shows that as the price retraced to Point 3, it stopped within 2 pips of the 88.6% Fibonacci level.
So the price retraced 1,821 pips over 27 weeks, and it still managed to hit a key Fibonacci level within 2 pips!
It’s worth looking at how this would have looked with all the other Fibonacci levels in real-time:

As the price moved up past the Fib levels, the price never hit any of them cleanly and reversed. It did come quite near the 50% level, made a bounce before moving back up. However, it hovered around the level for 3 weeks before moving down. When the price pinned the 88.6% precisely (a sign that that particular level is going to be respected), the price quickly and decisively moved down. A trader could then plan trades using Point 2 as a downside target. If the trader waited two bars (or two weeks) after the Fib level was hit to confirm the reversal, there was still over 1,000 pips available up to the Point 2 target.
Note: The 0.886 Fibonacci level is derived by taking the 0.618 Fibonacci golden ratio, square rooting it, and square rooting it again.
More basic than Fibonacci, are trendlines. Let’s look at a simple trendline using the last two major higher lows on the chart:

Shortly after the trendline is broken, the price moves back up and retests it again within a couple of pips.
The first low marking the beginning of the trendline is on 17 March 2008. The subsequent retest after the trendline is broken is on 1 December 2010. So a trendline that took more than two and a half years’ to form was retested again within 2 pips. Since the retest, the price has moved more than 800 pips: very precise technicals especially given the hundreds of pips the price moved to meet the levels.
So what’s my point?
1. Technical Analysis can be as precise on long-term charts as on short-term charts.
2. You can use long-term Technical Analysis independently of other analysis.
3. You can use long-term Technical Analysis to plan trades.
Thursday 20 January 2011
Two 50+ pip trades on USD/JPY
In my last post, I identified two key support levels in the USD/JPY based on the long-term chart: the first one was made in April 1995, a multi-decade low of 79.75. The second support level was made recently in October 2010, at 80.24, almost touching the historic low.
Let’s look two trades that unfolded since that post.
I suggested that with the recent support made at 80.24 and it being so close to the historic support, 79.75, this would be a good time to plan trades.
According to classic Technical Analysis, you buy off support levels; if the support gets broken and tests it as a resistance, then you sell from the previous support.
So in line with the logic that we’re trading above key support levels, I looked for buy trades.
The very time of the post was a good entry for a long trade. There were some chart patterns that indicated a bullish momentum.
1. Key trendline was broken and retested before moving up
2. Recent “Double Bottom”
3. Forming of a “Base” bottoming pattern
4. Recent 78.6% Fibonacci bounce
5. Recent 88.6% Fibonacci bounce

Trendline break & retest

Double Bottom pattern

Base pattern

78.6% Fibonacci bounce

88.6% Fibonacci Bounce
At the time of the post, the price was consolidating nicely. The price was making higher lows, and it almost immediately made a new 61.8% Fibonacci bounce:

61.8% Fibonacci bounce just prior to trade entry
So technically, the picture was looking bullish.
As the consolidation was tight, a 25 pip stop would have covered you easily. If you planned your trade around a simple 1:2 risk/reward ratio, you would have earned your 50 pips within hours. The price did actually rocket over 100 pips; that said, I rarely exit a trade after three times my risk, i.e. 75 pips in this case.
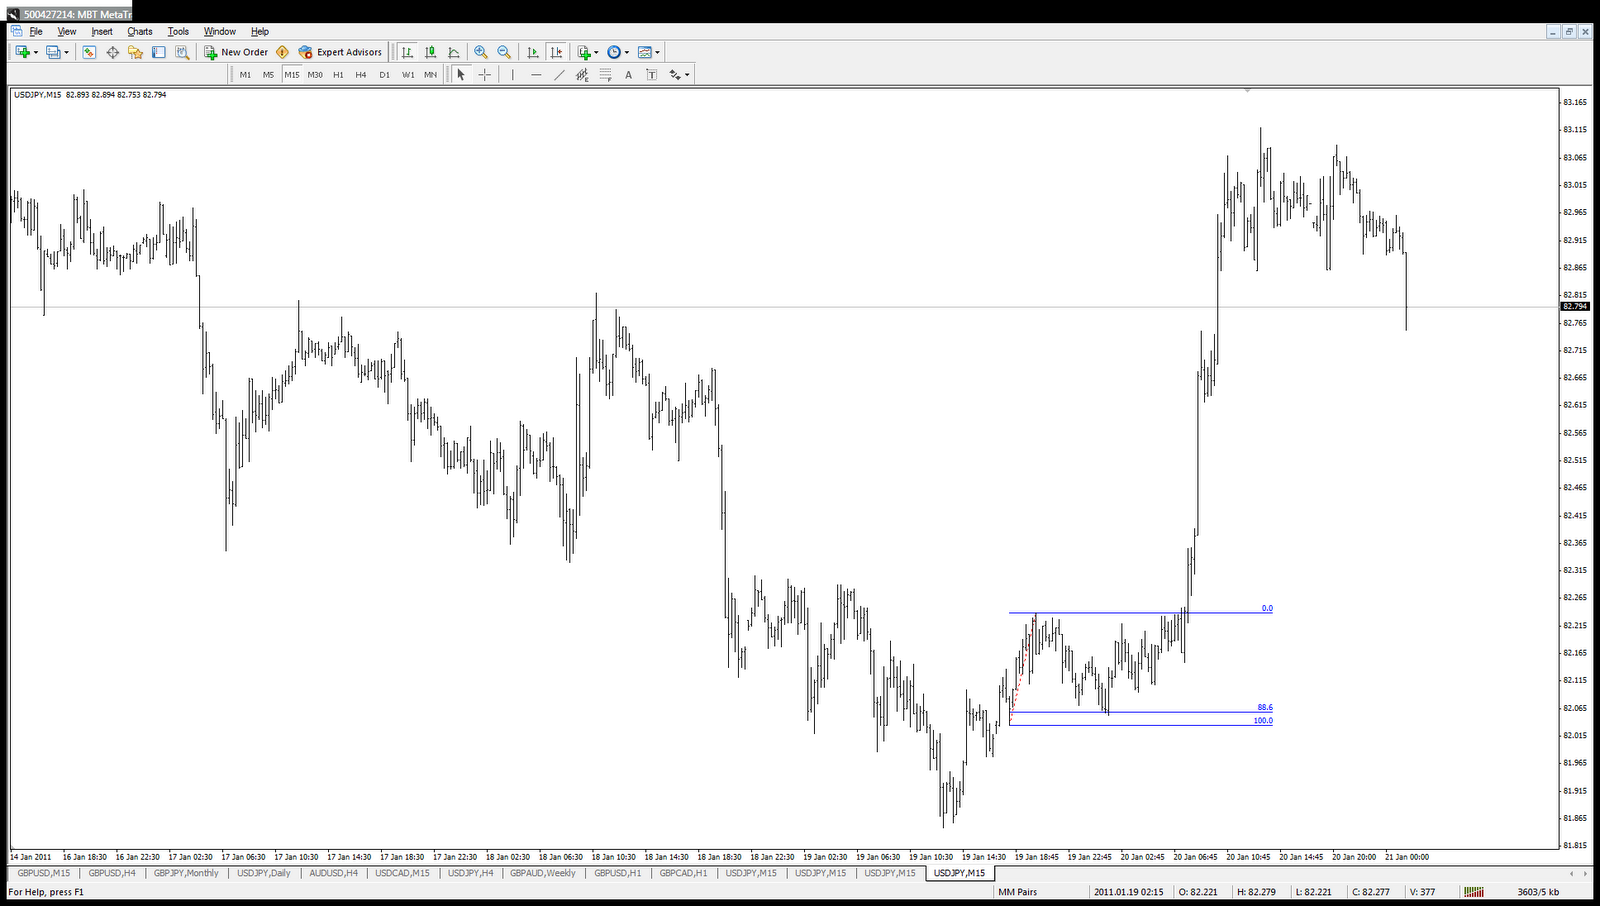
More recently, there was a brilliant text book example of a Reverse Head & Shoulders pattern. See the below chart:

The blue lines on the next chart mark an 88.6% Fib Bounce for the Right Shoulder:

88.6% Fibonacci bounce forming Right Shoulder of Reverse Head & Shoulders
My entry was at the consolidation for the Right Shoulder, 25 pip stop. I exited at 50 pips but the trade could have netted over 80 pips. I was content with a 1:2 risk/reward ratio on this trade.
H. Hamid
Let’s look two trades that unfolded since that post.
I suggested that with the recent support made at 80.24 and it being so close to the historic support, 79.75, this would be a good time to plan trades.
According to classic Technical Analysis, you buy off support levels; if the support gets broken and tests it as a resistance, then you sell from the previous support.
So in line with the logic that we’re trading above key support levels, I looked for buy trades.
The very time of the post was a good entry for a long trade. There were some chart patterns that indicated a bullish momentum.
1. Key trendline was broken and retested before moving up
2. Recent “Double Bottom”
3. Forming of a “Base” bottoming pattern
4. Recent 78.6% Fibonacci bounce
5. Recent 88.6% Fibonacci bounce

Trendline break & retest

Double Bottom pattern

Base pattern

78.6% Fibonacci bounce

88.6% Fibonacci Bounce
At the time of the post, the price was consolidating nicely. The price was making higher lows, and it almost immediately made a new 61.8% Fibonacci bounce:

61.8% Fibonacci bounce just prior to trade entry
So technically, the picture was looking bullish.
As the consolidation was tight, a 25 pip stop would have covered you easily. If you planned your trade around a simple 1:2 risk/reward ratio, you would have earned your 50 pips within hours. The price did actually rocket over 100 pips; that said, I rarely exit a trade after three times my risk, i.e. 75 pips in this case.
More recently, there was a brilliant text book example of a Reverse Head & Shoulders pattern. See the below chart:

The blue lines on the next chart mark an 88.6% Fib Bounce for the Right Shoulder:
88.6% Fibonacci bounce forming Right Shoulder of Reverse Head & Shoulders
My entry was at the consolidation for the Right Shoulder, 25 pip stop. I exited at 50 pips but the trade could have netted over 80 pips. I was content with a 1:2 risk/reward ratio on this trade.
H. Hamid
Tuesday 4 January 2011
Yen at historic multi-decade support level

Today's post isn’t a specific trade recommendation, but a key chart observation to help plan future trades.
This is a very interesting time for the USD/JPY coming near a major support level, and the lowest level for over 20 years.
Looking at a chart with monthly bars stretching back to late 1988, USDJPY traded at a low of 79.750 in April 1995. The pair came tantalisingly close to that level in October 2010 trading at a low of 80.241.
For many months, I’ve been reading how the Yen is fundamentally overvalued: Japan has had zero interest rates for over a decade, the country has an aging population, the strong Yen is killing exports and the country’s debts are large compared to other industrialised nations.
I’ve never placed trades based on fundamental plays, because I believe good technical analysis can interpret and time the fundamentals better, as well as account for other factors such as market sentiment.
That said, the current Yen price level now could provide the crucial push for the Yen to weaken, placing it in line with strong fundamental influences.
If you’re involved with international trade, or are a longer term trader, the long-term USD/JPY chart should definitely be of importance to you at this juncture. I would be examining how it reacts to the historic support level - whether it bounces off the support, or whether the price moves through it, retraces and continues to move down to strengthen the Yen - as I believe a move in any direction will be strong.
H. Hamid
Subscribe to:
Posts (Atom)