Thursday, 20 January 2011

Two 50+ pip trades on USD/JPY

In my last post, I identified two key support levels in the USD/JPY based on the long-term chart: the first one was made in April 1995, a multi-decade low of 79.75. The second support level was made recently in October 2010, at 80.24, almost touching the historic low.

Let’s look two trades that unfolded since that post.

I suggested that with the recent support made at 80.24 and it being so close to the historic support, 79.75, this would be a good time to plan trades.

According to classic Technical Analysis, you buy off support levels; if the support gets broken and tests it as a resistance, then you sell from the previous support.

So in line with the logic that we’re trading above key support levels, I looked for buy trades.

The very time of the post was a good entry for a long trade. There were some chart patterns that indicated a bullish momentum.

1. Key trendline was broken and retested before moving up
2. Recent “Double Bottom”
3. Forming of a “Base” bottoming pattern
4. Recent 78.6% Fibonacci bounce
5. Recent 88.6% Fibonacci bounce


Trendline break & retest


Double Bottom pattern


Base pattern


78.6% Fibonacci bounce


88.6% Fibonacci Bounce


At the time of the post, the price was consolidating nicely. The price was making higher lows, and it almost immediately made a new 61.8% Fibonacci bounce:


61.8% Fibonacci bounce just prior to trade entry

So technically, the picture was looking bullish.

As the consolidation was tight, a 25 pip stop would have covered you easily. If you planned your trade around a simple 1:2 risk/reward ratio, you would have earned your 50 pips within hours. The price did actually rocket over 100 pips; that said, I rarely exit a trade after three times my risk, i.e. 75 pips in this case.

More recently, there was a brilliant text book example of a Reverse Head & Shoulders pattern. See the below chart:


The blue lines on the next chart mark an 88.6% Fib Bounce for the Right Shoulder:
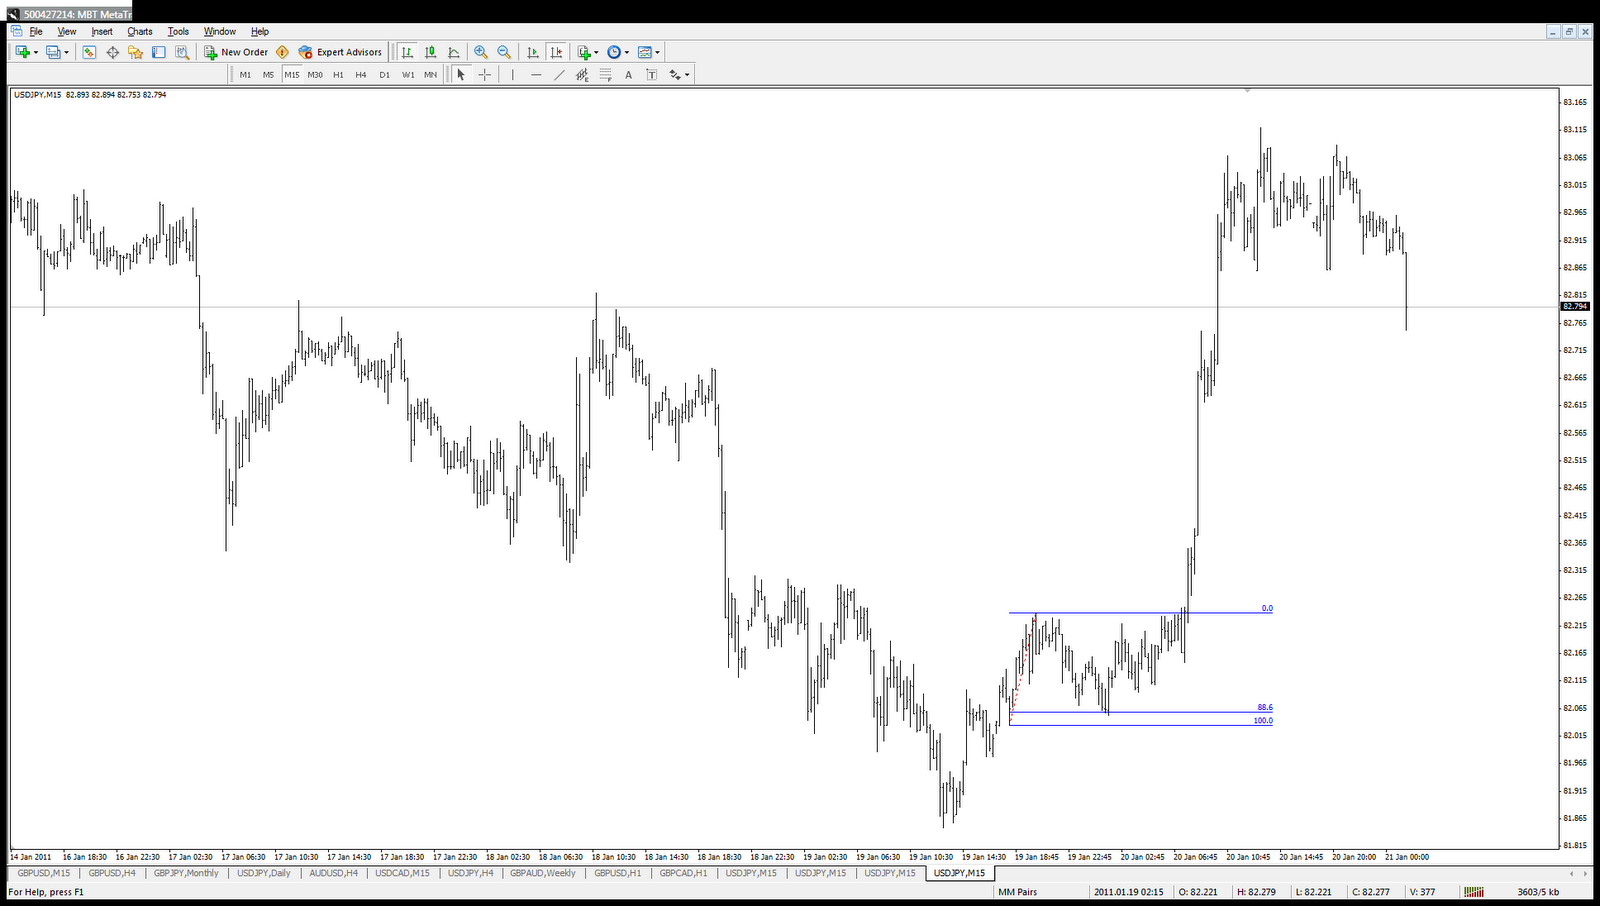

88.6% Fibonacci bounce forming Right Shoulder of Reverse Head & Shoulders

My entry was at the consolidation for the Right Shoulder, 25 pip stop. I exited at 50 pips but the trade could have netted over 80 pips. I was content with a 1:2 risk/reward ratio on this trade.

H. Hamid

Tuesday, 4 January 2011

Yen at historic multi-decade support level


Today's post isn’t a specific trade recommendation, but a key chart observation to help plan future trades.

This is a very interesting time for the USD/JPY coming near a major support level, and the lowest level for over 20 years.

Looking at a chart with monthly bars stretching back to late 1988, USDJPY traded at a low of 79.750 in April 1995. The pair came tantalisingly close to that level in October 2010 trading at a low of 80.241.

For many months, I’ve been reading how the Yen is fundamentally overvalued: Japan has had zero interest rates for over a decade, the country has an aging population, the strong Yen is killing exports and the country’s debts are large compared to other industrialised nations.

I’ve never placed trades based on fundamental plays, because I believe good technical analysis can interpret and time the fundamentals better, as well as account for other factors such as market sentiment.

That said, the current Yen price level now could provide the crucial push for the Yen to weaken, placing it in line with strong fundamental influences.

If you’re involved with international trade, or are a longer term trader, the long-term USD/JPY chart should definitely be of importance to you at this juncture. I would be examining how it reacts to the historic support level - whether it bounces off the support, or whether the price moves through it, retraces and continues to move down to strengthen the Yen - as I believe a move in any direction will be strong.

H. Hamid

Monday, 27 December 2010

Profit Target Hit: 50+ pips

A few hours ago I posted a quick note on the GBP/USD looking bullish and a possible Long/Buy trade setup.

The price at the time of writing was 1.5419 at around 16:45 EST (21:45 GMT). As the price was moving sideways into a nice little triangle, it made for a perfect entry. I stated a profit target of 1.5475. The profit target was hit around 19:15 EST (00:15 GMT), or about two and a half hours later. The trade would have yielded 56 pips if entered at the time of the post.


What made the trade better was that the price moved less than 5 pips against you at the time of the post. A sensible stop-loss would have been 25 pips or so, giving a slightly better than 1:2 risk/reward ratio.

As I always say at the end of my posts, trade with a stop-loss and enter only when you have a good risk/reward ratio.

H. Hamid

Bullish GBP? 88.6 Fibonacci Bounce

On 14 December, GBP/USD began a downtrend that moved the pair about 550 pips from a high of 1.5911 to a recent low of 1.5357 made on 22 December.

Since the low of 1.5357, GBP/USD has been moving sideways building a nice base. It recently made a bounce off the 88.6 Fibonacci level: the price moved from Point 1 to Point 2, and then retraced 88.6% to Point 3 before starting to move up again.


The recent consolidation as seen on the 15 minute chart provided a good opportunity to get into a long position. Point 2, 1.5475 is a potential profit target.


Always trade with a stop, and trade when the risk/reward ratio is in your favour.

H. Hamid

Monday, 24 May 2010

100 pip plus move on GBP/USD – Reversal Bar

Thursday (20 May) produced an interesting opportunity on Cable (GBP/USD) that tied in to my analysis from my last post. In the previous post, I pointed to the validity of the recent support at the 1.4240 area that met some major Fibonacci extension levels. Here are the charts again.


And here is a combined chart of all the Fibonacci Extensions:


Upon that analysis, if you were monitoring the charts to look for a long entry assuming that support area of 1.4240, Cable produced a solid reversal bar on the hourly chart.


Chart reference: hourly bar 2010.05.20; 10:00 EST

I saw this as a key reversal bar for several reasons: it “spiked” down into the area of support highlighted in my last post; the open and close are near the top of the bar and lastly the bar itself had a good range. You can see the same reversal also on the 15 minute chart below just as clearly:


Chart reference: 15 minute bar 2010.05.20; 10:15 EST

Aside from the Fibonacci points in the above charts, there was a fourth major extension that this reversal bar hit very cleanly: (The reversal bar is marked with the horizontal blue line.)


Chart reference:
Hourly bars
Point A – 2010-04-15; 02:00 EST; 1.5522
Point B – 2010.05.07; 05:00 EST; 1.4475
Point C – 2010.05.10; 09:00 EST; 1.5053


To recap on Fibonacci Extensions, the price moved from Point C 78.6% of the distance from covered by Point A to Point B.

The previous resistance on Cable was 160 pips above the close of the reversal bar. This entry should have netted a trader at least 100 pips with an early exit. I personally traded from the 15 minute chart that allowed me to keep a tighter stop (just below the low of the reversal at 1.4227) and a better entry.

As I always say, never trade without stops and keep an eye on your risk reward ratios at all times.

H. Hamid

Wednesday, 24 March 2010

80 pips overnight - GBP/USD

This is the last trade I took approximately 24 hours ago and it is worth posting on here as it ties in nicely with the previous Fibonacci analysis that I’ve given.

I noticed on the 15 minute GBP/USD chart a clean 88.6% Fibonacci retracement.

To recap from previous analysis, I use a bounce off the 88.6% level as an indication of a new move that is an extension in size of the initial wave, or Wave 1. (This will become clearer in the coming charts.)

This is the point at which I saw it (See Chart 1):


I could have entered a short position immediately but the nearest place for a stop was around 45 pips away; whilst the nearest profit target was over 80 pips giving an okay risk/reward, I felt I could get a better stop on a consolidation. So instead I wanted to wait for a pull back or consolidation to plan the trade from. The risk with this is missing the trade entirely as the price could just rocket down.


Getting into the trade

When I checked the chart again, I noticed a triangle consolidation that the price had just broken out from and decided this made a good entry point. I used a 25 pip stop that was essentially just above the triangle. See Chart 2.


Getting out of the trade

My target was a 100% extension of Wave 1. This means you take the size of Wave 1, i.e. from Point X to Point 1 on Chart 3, and measure 100% of that size from the end of Wave 2 or Point 2 on the chart. It gave me a target of 1.4957 – about 80 pips away from entry. That gave me a risk/reward ratio of over 1:3 which I think is very acceptable.


When it hit the target, it broke it by 1-2 pips before rebounding and going through it firmly. See Chart 4.


Would I have done anything differently?

It’s worth considering that the underlying premise of the trade was an “extension” of Wave 1. Hence I could have held my position or part of my position for either the 138.2% or 161.8% extension levels. Both of these were broken soundly within a short time adding an extra 100 pips of profit.


These charts are all 15 minute bars.
Point X: 23.45 EST bar; high: 1.51018
Point 1: 07:00 EST bar; low: 1.49718
Point 2: 12:15 EST bar; high: 1.50869

H. Hamid

Sunday, 21 March 2010

150-300 pip move – GBP/USD

These last several days have presented some excellent opportunities on GBP/USD that are well worth examining especially in the light of the analysis I posted last week on this pair.

To recap, look at Chart 1: last week, I highlighted a bounce off a key Fibonacci level, 88.6% and proposed that it would create an extension of Wave 1 from the Bottom of Wave 2.


Let’s briefly touch upon the importance of the Fibonacci number 88.6%. This number is the square root of 78.6%, which itself is the square root of 61.8%, or the Fibonacci Golden Ratio. In my own experience, a bounce off 88.6% provides the strongest moves and moves that aren’t false; it is the only Fibonacci level I use without requiring many other confirming factors.

And more often than not, an 88.6% bounce means that the next move will extend the size of the initial move. On Chart 1, that means you can expect the move from the end of Wave 2 to be at least 100% of the size of Wave 1, if not bigger. This is the first important consideration when planning the trade: it means you can plan as a minimum target 100% of Wave 1 from end of Wave 2. Having a clear target means you can decide whether the risk is worth it before getting into the trade. Make sense so far?

Getting into the trade

So what happened next? At the time of the analysis last week, the price had just hit two coinciding Fibonacci levels and I advised that as it was sitting on some resistance, it would be better to buy on a dip below, which happened a short while later.


The first dip produced a nice spike down coinciding with another 88.6% bounce: see Chart 2. This Fibonacci point was a little harder to spot, but if you did spot it, even shortly after it happened (which was the case for me) rather than in advance, it added reinforcement to go long at that point. Entry just after the spike provides 150 pips at the very least, and much more as the trade unfolded.

The price then hit the extension of Wave 1 from the bottom of Wave 2 at exactly 138.2%. At the time of my initial analysis last week I thought 161.8% would be hit. At 138.2%, the trade provided 150 to 300 pips depending on where you got in and how you trailed your stops.

Getting out of the trade

Interestingly, after hitting the 138.2% extension, there was a subsequent 88.6% retracement in the other direction giving you a good warning that the up move is either going to struggle or is over: see Chart 3. This could also have been a valid reason to initiate a new short position.


Something I didn’t see at the time of the post last week was the importance of that 138.2% extension. If you looked at another longer term Fib retracement marked on Chart 4, that 138.2% extension is an exact match with a longer term 38.2% retracement marked by the blue lines. (This was a far better match than the longer term Fibonacci lines in my first analysis – as this time, the these lines met exactly.)


When Fibonacci lines meet exactly it can produce strong turning points. Notice how the price travelled hundreds of pips yet bounced cleanly off both lines within 1-2 pips. If that wasn’t a sign to exit, it should have been a sign to keep your stops close.

For reference, all the charts are hourly bars. However, equally 4-hour bars could be used.

H. Hamid